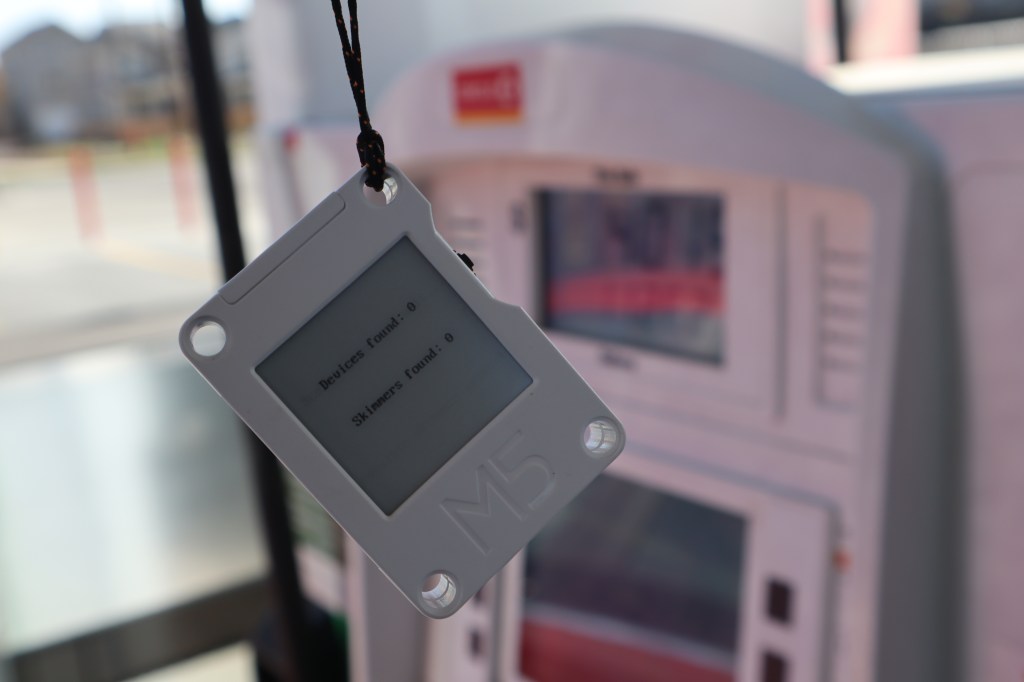
My latest project was recently featured on Instructables! In this guide I will show you how to build a low-power credit card skimmer detecting keychain. These skimmers, often found in gas pumps and ATMs, emit a Bluetooth signal that this keychain can detect but that many modern smart phones cannot. There is no need to understand programming and there is no soldering – this guide is suitable for beginners!
I am excited to share that my project, CarbonComponent, was recently selected as a winner of GitLab’s Innovation Pitch Competition! CarbonComponent is a continuous integration/continuous deployment component for GitLab pipelines that allows developers to estimate the carbon emissions caused by visiting their web projects. Using data from The Green Web Foundation it can tell if your web host uses green energy, and will provide you with a Green Webhost badge for your project repository if it does. When a pull request is created, metrics are displayed allowing you to tell at a glance if a change will make your project more carbon intensive. Additionally, it allows developers to offset the emissions from their project through Wren. Check it out! https://devpost.com/software/carboncomponent
This is a DIY Ghost Box like the Ovilus ghost hunting device. While I don’t believe in ghosts, I do think ghost hunting gear is fascinating. This box chooses words out of a 1000 word dictionary based on magnetic field and temperature changes. The code is available for free on GitHub: https://github.com/kevinl95/ghostbox
Electronics:
1x Adafruit Feather M4 Express (If substituting, make sure you either buy a board with a DAC for the speaker or build one)
1x Adafruit 9-DOF Accel/Mag/Gyro+Temp Breakout Board – LSM9DS0
1x Adafruit Illuminated Toggle Switch with Cover – Green
1x Adafruit Thin Plastic Speaker w/Wires – 8 ohm 0.25W
1x Adafruit Lithium Ion Battery – 3.7v 2000mAh
My brother had the awesome idea to stay organized this school year with a scrolling LED display that would read the next five tasks off a Google Calendar. This is the exciting end result! The LED display we used unfortunately ran only proprietary software called PowerLed, giving me no way to programmatically set the text the screen was displaying and instead requiring each line be manually entered (like some kind of neanderthal). Fortunately Python has tools for automating actions in even the gnarliest GUI programs, so I wrote up this guide about how I managed to make this dumb device smart!
THE PROBLEM
It’s <current year> and manufacturers are still shipping hardware with awful proprietary software and no way for the end user to tinker with it. Additionally it is not web-friendly and all information has to be edited by hand.
The specific sign I worked with was this one although many signs originating in Asia ship with the same PowerLed software, so this guide should help you out! I made use of the WiFi interface, so if your sign does not have one you should check if it has a serial interface instead and make a few modifications to my program (remove the Wifi stuff, have the program click the button to send the configuration over USB for example).
There are a number of tools that let you click through GUI programs and automate tasks with Python, but today I am going to focus on pywinauto, a popular set of modules for automating tasks in Windows GUI programs. This is appropriate because as far as I can tell my sign only came with a Windows version of the software (although there are mobile apps that work with it supposedly). Pywinauto works by opening a program at a specified path and then navigating down menus it can see. For example, I can tell it to send my configuration by telling it to click a certain member of the Tools menu at the top of the screen: ‘window.menu_select(“Tools(T)->Send All”)’. It’s that easy! Those names were copied directly from the GUI itself.
I made use of the Google Calendar API which lets me programmatically pull down information from a Google Calendar. At the time of writing Google gives a generous one million queries per day which I cannot imagine one person would ever be able to exceed. To be safe though, my code updates the sign’s text every three minutes (although this can be changed at the top of main.py). The program I wrote pulls down the next five events on your calendar and processes them to be displayed by the sign.
How does this all work?
PowerLed uses ledprj files which are essentially just XML files. I made my own template with placeholder text (‘REPLACE1’, ‘REPLACE2’, etc.) and saved this template alongside my Python script. This template let me play with scroll speed, font size, and other settings using the PowerLed software and trial and error with my display. To automate updating the template with Python, I simply read in this template file and do a find/replace for ‘REPLACE1’ and so forth with the five events I pulled from Google Calendar. When PowerLed reads this file, these strings are sent instead!
The LED sign broadcasts its own WiFI network that I must connect to in order to update the device. I use subprocess calls to netsh to drop off my WiFi and then connect to the display.
I use pywinauto to open PowerLed, which I have already pointed at my LEDprj file, and connect to the device. I then automated the process of pressing the ‘send’ button to update the display. Once updated, pywinauto automatically closes PowerLed.
The project then waits three minutes and pulls down the next five events again, updates the sign, and so on until the program is stopped.
By noticing that the LEDPrj files were really just XML files I saved a great deal of time reverse engineering how I can get Python to update this sign. While there is no API or command line interface for the software, pywinauto let me quickly get the computer updating the sign itself.
Now I am sure you’re thinking ‘This is all fine and good, but do I need to let this program run forever, popping open this PowerLed thing every three minutes?’ – the answer is yes. But there is a solution! Upcycle an old laptop (68% of Americans have an unwanted computer in their home) or make use of a cheap Intel Compute Stick or similar device (make sure it runs Windows, the cheapest ones run Linux). I used an inexpensive Windows compute stick with an Intel Atom processor inside that more than handily can run this program on loop forever.
How do you get this set up for yourself? Head on over to the Git repo and check out my README, it’ll fill you in! The gist is to clone the repository, follow Google’s procedure to enable the Calendar API and get a credentials file, change the values in the program so that it knows what time zone you are in and what networks it needs to connect to (I don’t pass credentials, the program expects you to have connected to your sign and your home network before) and then give it a try!
TROUBLESHOOTING
I assume you have PowerLed installed and you made sure the path in the program is pointed at where you installed it
I assume you have connected to your sign and your home network before
I assume that you have loaded display.ledprj in PowerLed and then exited the program so that it will load next time you open PowerLed
I assume you are running Windows and that you have installed Python 3
My father loves to collect vintage wooden soda crates. These used to be used to deliver soda bottles to grocery stores, and many were lost either due to rot or because they were replaced with plastic crates and tossed. They feature beautiful vintage logos and artwork and serve as advertising pieces. Today they are highly collectable, and make for some fantastic up-cycled storage.
I wanted to build my dad a set of shelves that he could use to display his crates as well as use them functionally as storage. As usual, I jumped to my favorite computer aided design program, OnShape, to start sketching up the perfect soda crate shelving cart. First however I needed to know what I was going to make the shelves out of.
My dad had found another design online where the builder had welded a cart together that he really liked, and it had an awesome industrial look. I am not a welder, but I loved working in the machine shop in college. One of my favorite things to build with is 80/20, which is pretty much a heavy-duty erector set for adults. We used it to hold up heavy vacuum chambers and other equipment, but 80-20 also has a lightweight series called Quick Frame which features 1″ by 1″ aluminum extrusions and is far cheaper than its industrial counterpart. These square extrusions can be stuck together using a variety of plastic connectors, and there are extrusions with flanges perfect for holding up the crates. Even better they offer cheap machining services which means that I could literally design a complete shelf on my computer and have them cut each piece to size and ship it to me – I would just need to assemble it!
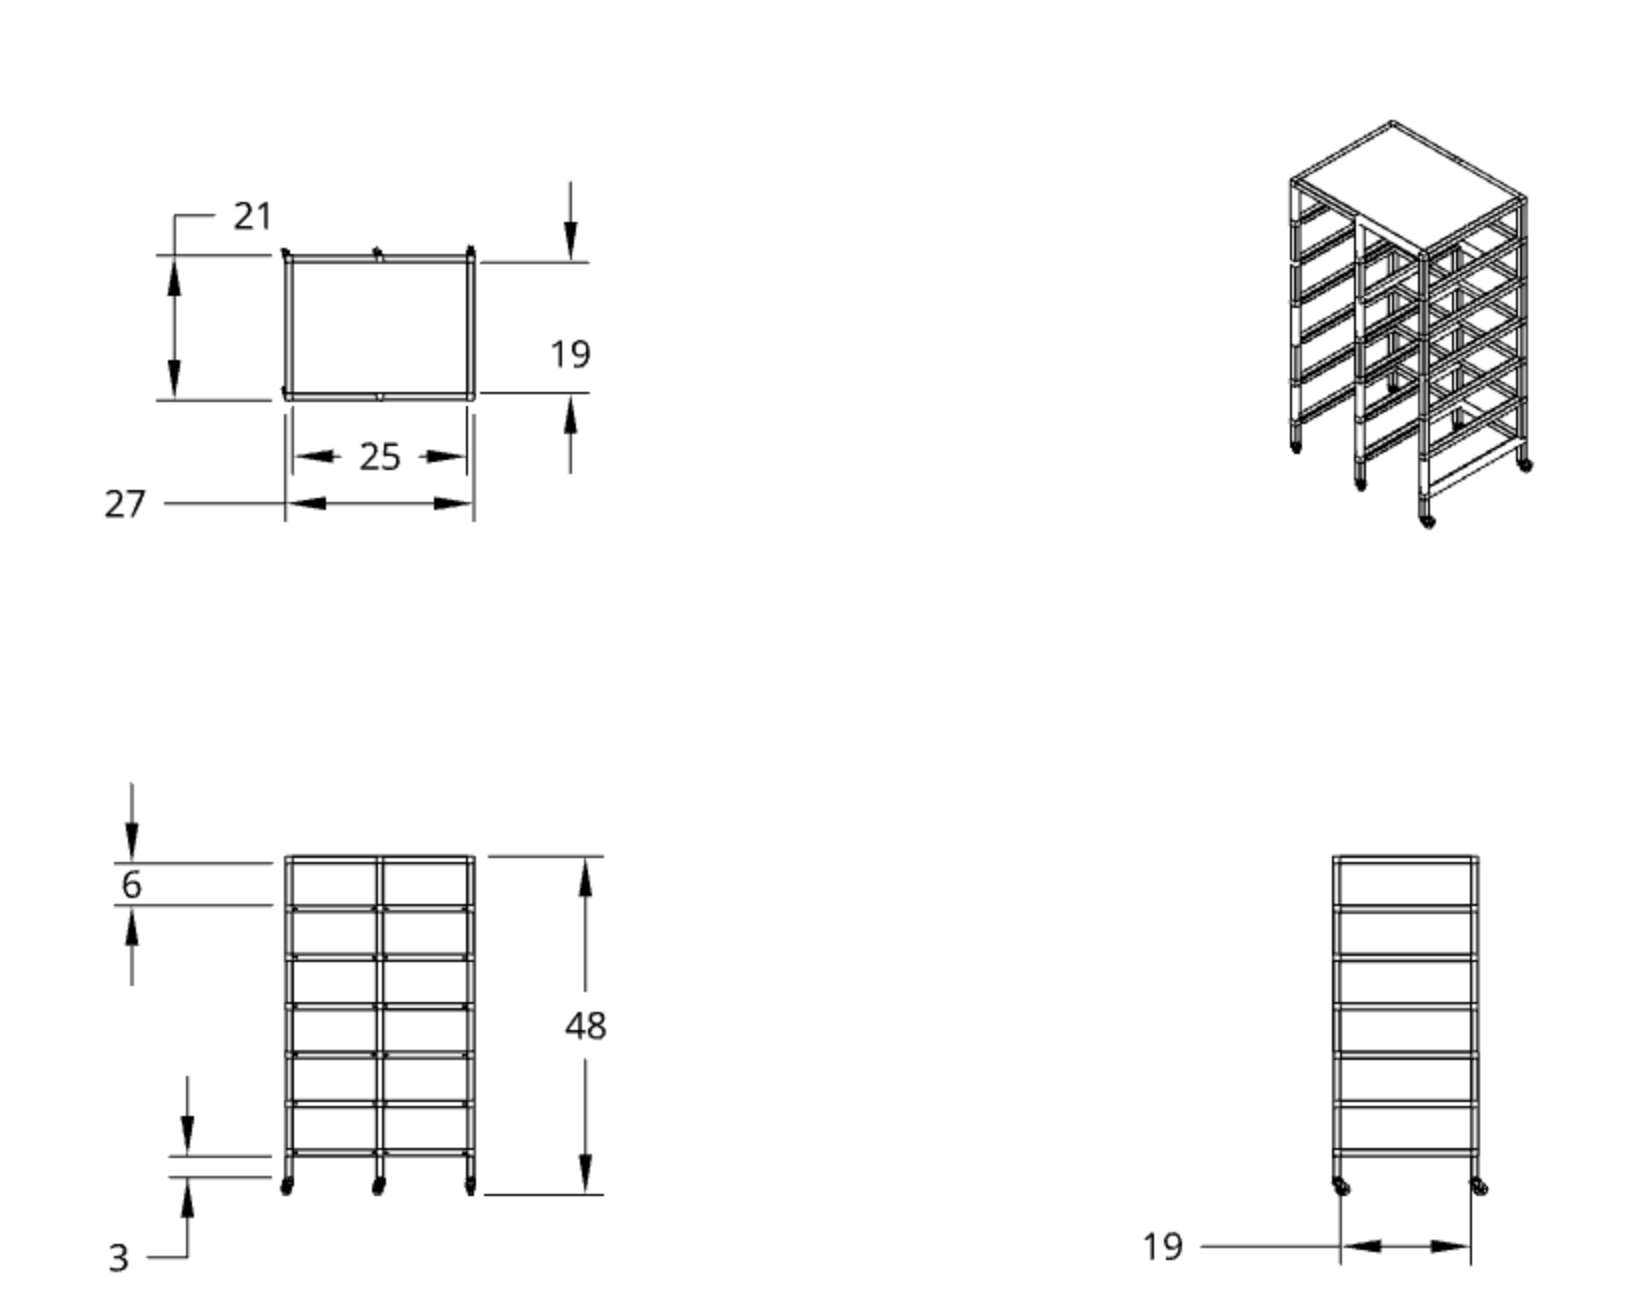
Also working in my favor was that the crates are roughly standardized- roughly each one is 4″ tall, 18.5″ deep, and 12″ wide. This let me assemble a repeating pattern of aluminum bars with flanges on the sides to support the crates, and design for having six inches for each shelf, giving 2″ of additional storage above the crate. I also added caster wheels to the bottom so that the shelves could be mobile, adding to the industrial look. To finish the shelves off, I added a wooden shelf on top to store the odd-sized crates in my dad’s collection. The final design ended up looking like this:
A roughly dimensioned drawing of the shelves.
OnShape let me render this design using RealityServer, which gave this gorgeous render of what the eventual shelves would look like:
Sure enough, on assembly this is exactly how the shelves looked! And there is plenty of room for my dad to collect more. Happy Father’s Day!
Do you remember playing Roller Coaster Tycoon, the famous amusement park simulation game that shattered sales records and that remains one of the most beloved computer games of all time? I do, and I also remember the most important part of building any roller coaster in the game – testing. While it may seem mundane to someone who has never played, testing was how you figured out if your ride was going to make any money. The game would give your ride a score in three categories- excitement, intensity, and nausea. The goal was to maximize excitement, keep intensity reasonable, and keep nausea minimal. Largely this score was determined by the g-forces your ride produced. High g-forces could mean high excitement or it could mean people are too afraid to go on your ride. These ratings each varied from ‘low’ to ‘ultra-extreme’- both being scores you generally wanted to avoid. ‘Medium’ and ‘High’ were the sweet spot (except for nausea of course, which you always wanted ‘low’) and if you started to edge into ‘Very-high’ intensity you would start to see a drop in ridership, and thus revenue.
G-force relates the acceleration produced by something to the gravitational pull of the Earth. Most roller coasters pull at most 5G’s, or 5 times Earth’s gravity. They only do this briefly though- on big hills or tight turns. The Space Shuttle, for example, pulled 3Gs on reentry and sustained them longer – amusement park goers are clearly not astronauts! Big drops, lots of inversions, intense helixes, and lots of air-time (or negative Gs, where you feel like you are floating out of your seat) are what sell big rides. While real coaster designers don’t use the Roller Coaster Tycoon rating system to determine if their ride is any good they surely have the same design philosophy- be exciting, be intense but not too intense, and make sure the poor teenagers running the thing aren’t scrubbing vomit off the seat every time people get off. I hypothesized most rides, if they were in the game, would probably fall in the ‘Medium’ to ‘High’ intensity and excitement scores. Fortunately we now all carry around an accelerometer in our pockets built right into our smart phones so we can find out for ourselves!
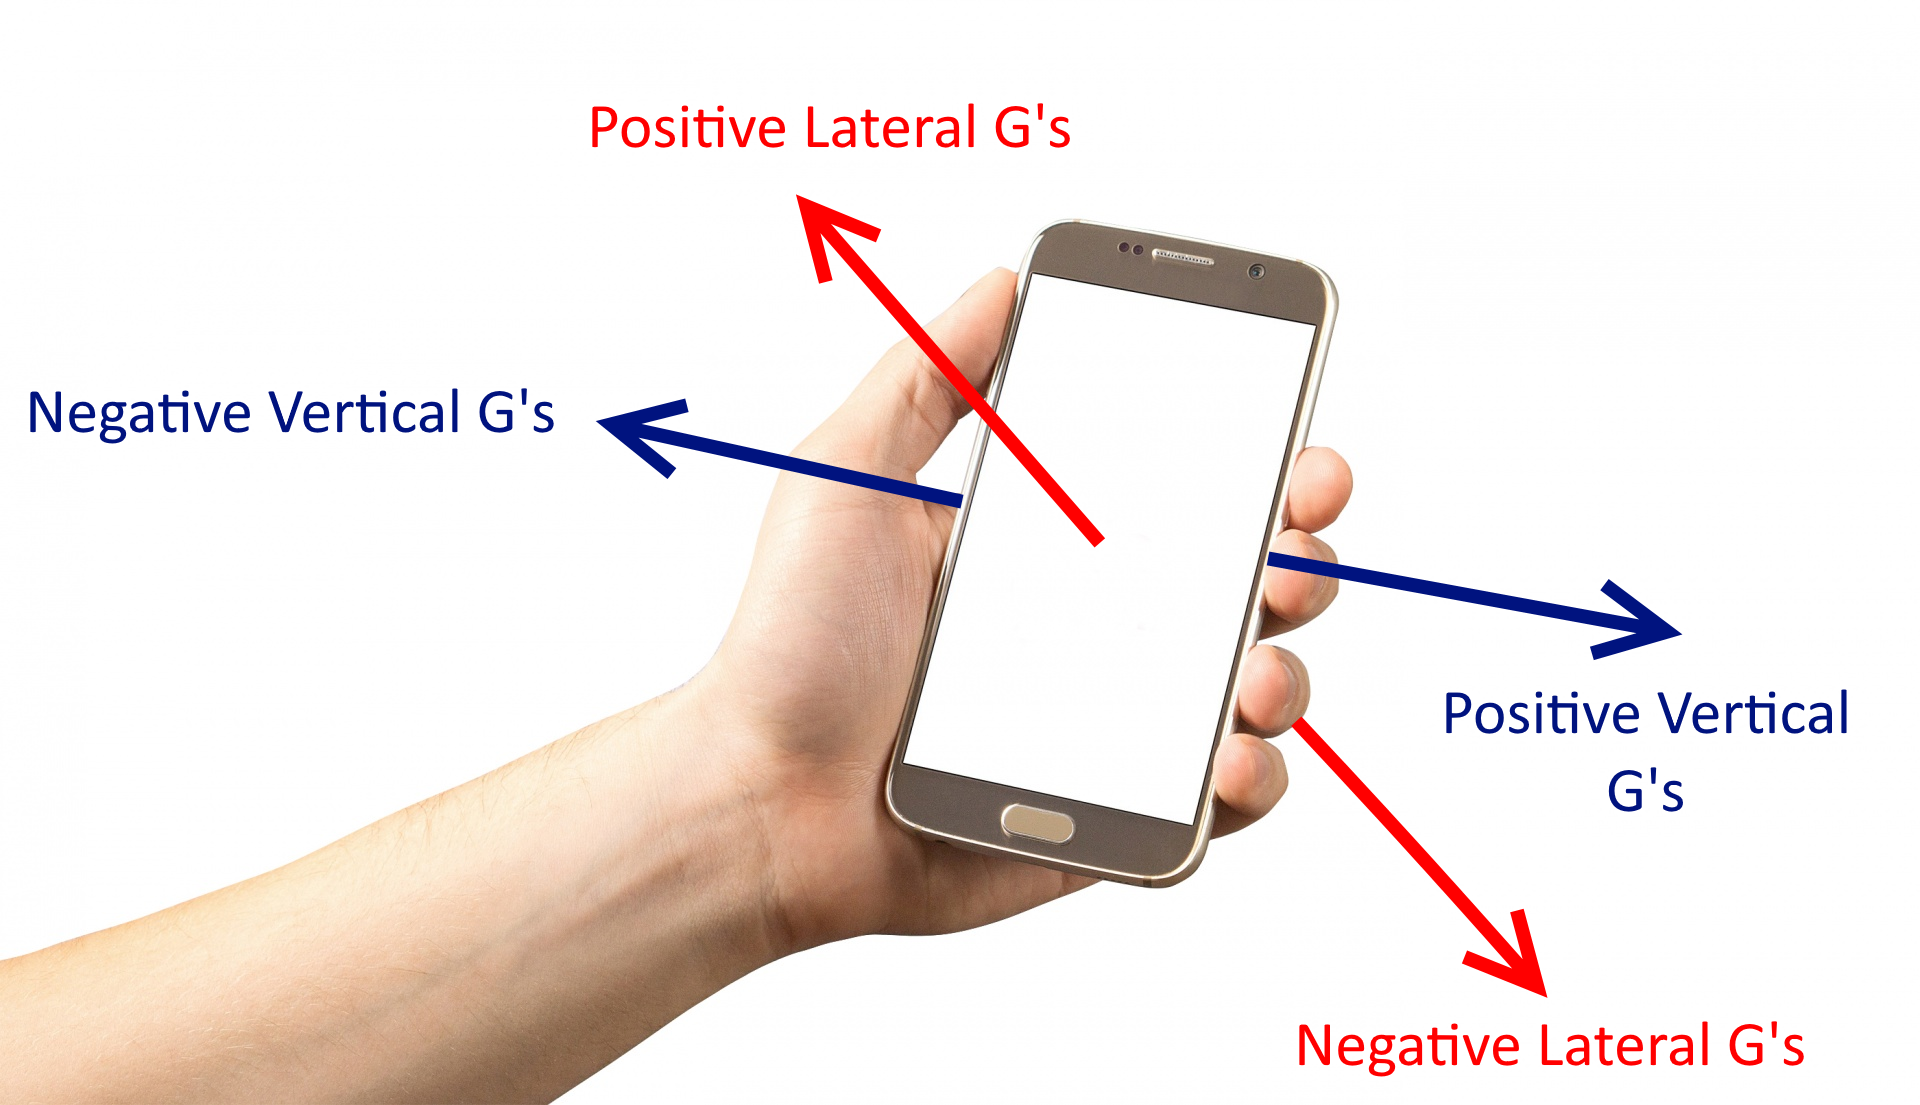
This diagram shows how the accelerometer maps to the G’s measured by the Roller Coaster Test Meter.
The above diagram shows the axes I chose so that your phone could measure acceleration while resting safely in a zipped or sealed pocket while you rode a roller coaster. Vertical Gs are along your phone’s x-axis while lateral G’s are measured along your phone’s z-axis. This assumes that you put your phone into your pocket with your screen facing to your left and top-first, by convention.
The game’s formulas for computing the ratings for each ride were somewhat mysterious until the OpenRCT2 project published their open-source code and formulas. We knew for years that primarily the g-forces the ride produced made up the bulk of the score, and other features like theming, dueling trains, and music among other things also contributed. There are also unique multipliers for each ride that come into play.
I am simply trying to build a toy however that you can turn on, throw in a pocket, and share with your friends so I avoided the design route of asking you a whole survey about the ride’s features before you get on. Instead I went a different route to produce a set of formulas that roughly approximate that in the game regardless of what kind of roller coaster you are on, mystery multiples and all, by comparing the scores of real roller coasters to those in the game. Fortunately this summer I have had access to a roller coaster that was in the game and that I could ride in real life- a ‘boomerang’! These roller coasters are everywhere, as they have a small footprint and low cost that makes them perfect for parks wanting to add a coaster on a small budget. The model in the game is ‘Defibrillator’ and it can be found in the ‘Funtopia’ scenario of the original game.
So, readers, I rode it just for you! Just kidding- I am obsessed with roller coasters and the fact that I needed to ride one to complete this project was no coincidence. I started building a prototype of my app using Ionic and Apache Cordova, which would enable me to release my app for you on either Android or iOS without needing to rewrite any of my code. There are excellent tools for making a fun UI (I tried to keep the colors and theming true to the original game) and you can import great packages for social sharing and interfacing with the accelerometer. I ran my app and saved the base score using the basic formulas from OpenRCT2 with no multiples. I then tested for the scores for ‘Defibrillator’ in the game, computed my multiples empirically to scale my ratings appropriately, and voila! We now get scores we would expect if real coasters were in the game!
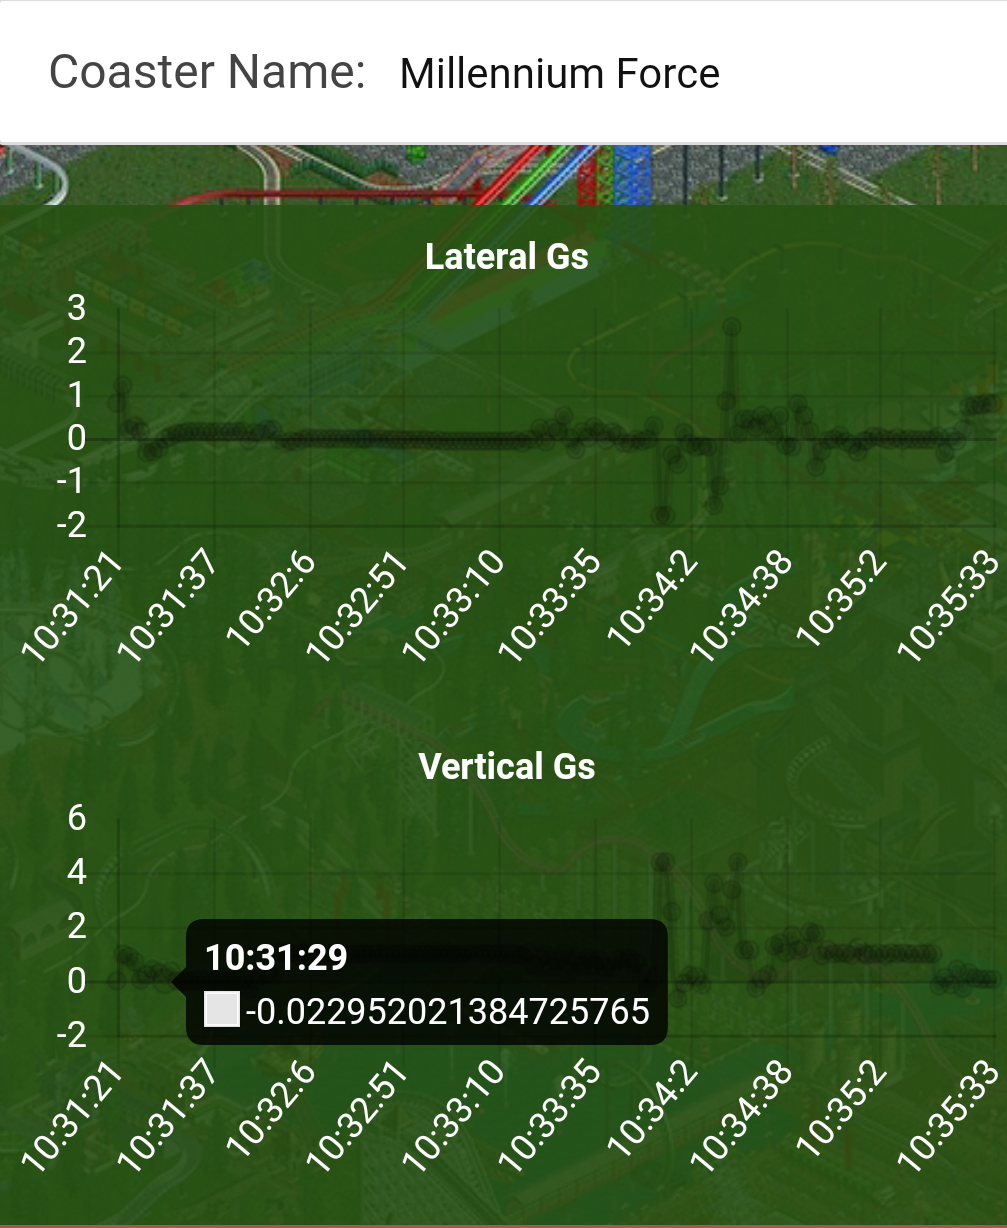
My Boomerang test ride with raw (unscaled) scores reported at the bottom.
Additionally I wanted to provide you with the raw data that went into your scores, just like the game. I used the awesome Chart.js library to plot the vertical and lateral G-forces live for you right on the screen, letting you have a nice plot of the forces experienced on the ride once you’re done:
It is amazing fun- my favorite highlights are the legendary The Beast having an appropriate intensity of ‘Very-high’ and the crowd-favorite Maverick having excitement at ‘Very-high’. I even rode the new Steel Vengeance– just look at those vertical G’s! Simply download the app from Google Play or Apple App Store, insert the phone top-first and screen facing left into a pocket, and hang on tight! Obviously follow any rules about loose articles (they are there for a reason) but generally as long as you have a pocket that can be sealed this is a fun way to rate coasters, plot their g-forces, and brag to your friends about how you pulled 5G’s on Steel Vengeance this summer. Once you hit the ‘end’ button hit ‘share’ and post the scores to social media, then hit ‘clear’ and enter the next coaster’s name before going and conquering it. Have fun and make good choices!
I’m at PyCon 2018 in Cleveland this upcoming week, so I thought that it would be a great time to post a quick Python writeup on how you can collect data from microcontrollers like Arduino and then save the data to your PC to process however you wish! PySerial makes this remarkably easy. This is a great project for science teachers as they show how you can use simple, ~$10 microcontrollers to create excellent data collection systems by connecting a few sensors and modifying my simple software! If you want to skip the tutorial you can download my software for Windows or Mac at the bottom of this page or use the link there to clone my repository on GitHub.
As usual,
THE PROBLEM
How can I collect a bunch of sensor data and then save it to my computer so that I can analyze it in a Jupyter notebook or in Excel?
THE SOLUTION
Over serial, and then use a simple Python program to save the data into a format like CSV that can be easily read by any analysis program!
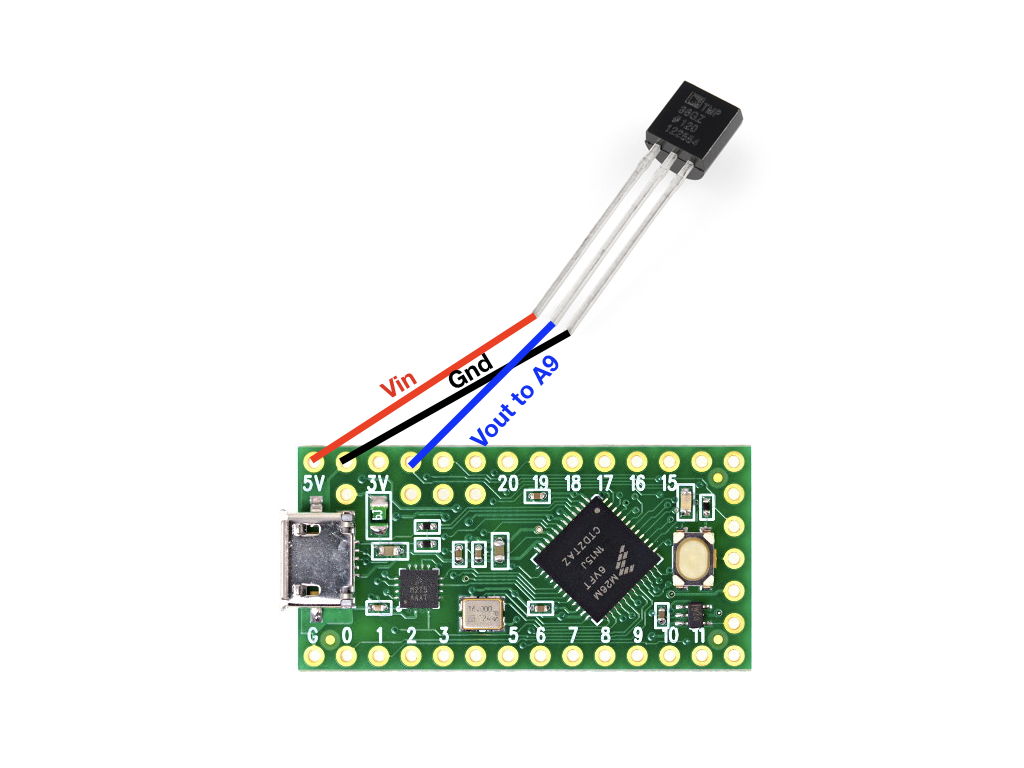
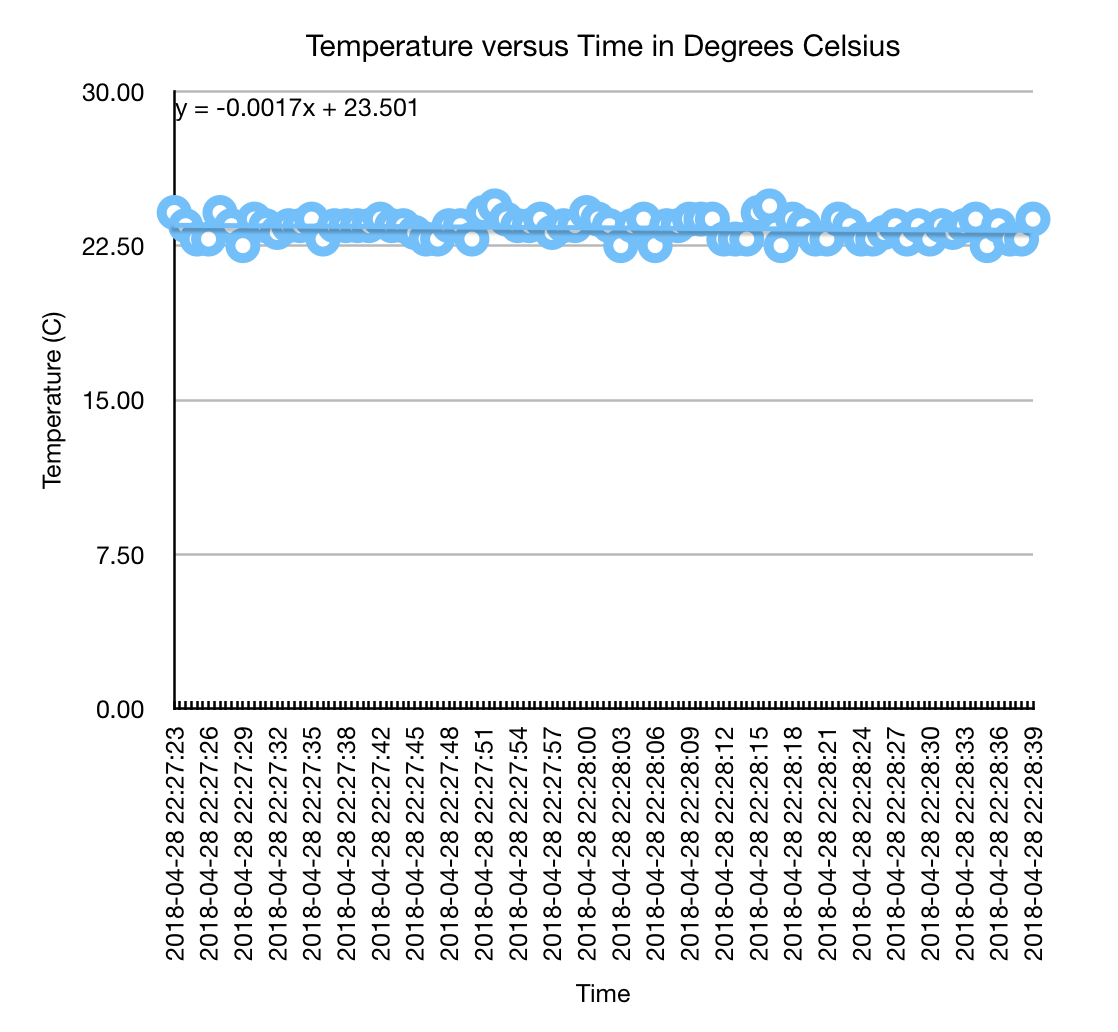
For this writeup, I was specifically trying to collect data from an analog temperature sensor (TMP36) and then plot that temperature over time. I used a Teensy LC- a $12 Arduino-compatible microcontroller board that is so cheap and easy to use that I throw them at any of my rapid-prototyping problems. It features an ARM Cortex-M0+ processor, lots of analog and digital pins (including capacitive touch!) and a convenient micro-USB port for setting up an easy USB serial connection.
Here’s how I wired up the sensor:
This probably would not pass UL certification.
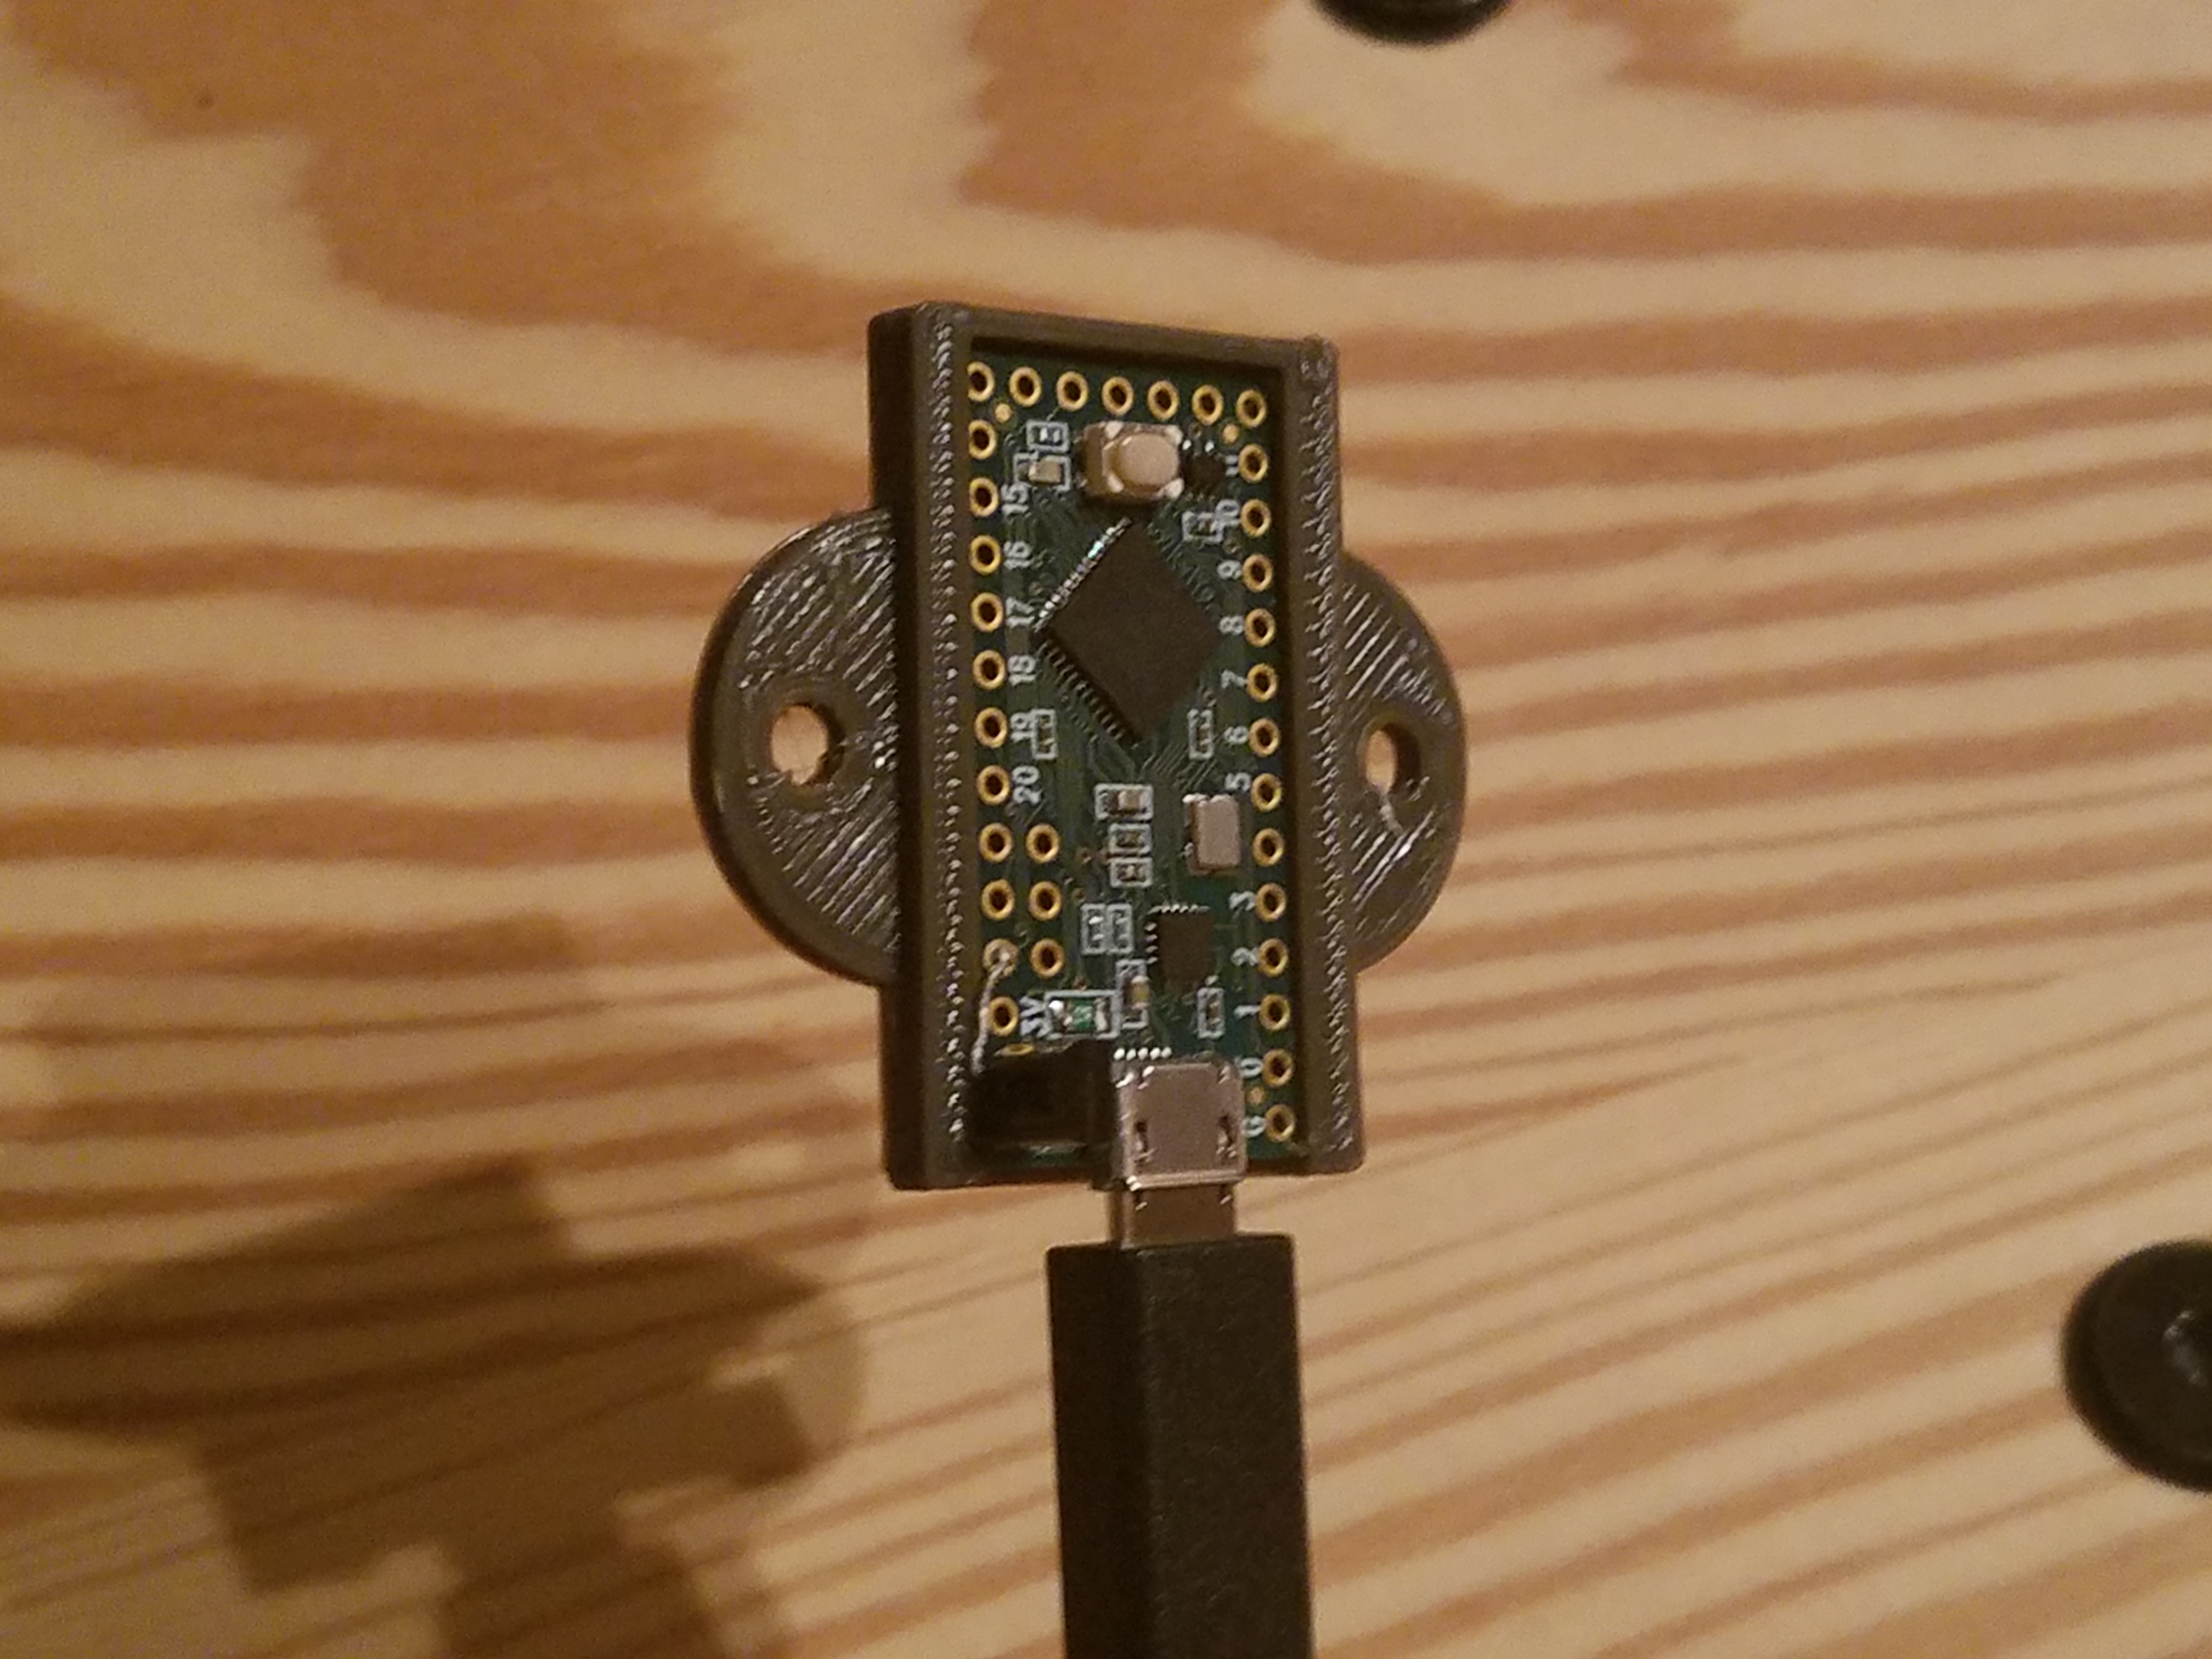
Since all of my projects must include 3D printing, I also 3D printed a great case off of Thingiverse by a user named Kasm that nicely contains the project and makes sure I don’t accidentally short any of the pins to anything:
Slightly more safe and professional looking. The temperature sensor is down on the bottom left.
For those curious how this works, the temperature sensor is an analog component that, when given 3-5V, returns a voltage that is proportional to the temperature around it. We are feeding the voltage into an analog to digital converter (ADC) so that our digital microcontroller can make sense of the reading. This means that in our code, we need to convert a number from 0-1023 back into a voltage so that we can use the formula from the data sheet to convert to a temperature. Fortunately, this is a simple conversion:
This will return a voltage in millivolts. The 3300 comes from the 3.3V reference voltage of the Teensy, and the 1024 comes from the Teensy having a 10-bit ADC, meaning it has 210 discrete analog levels.
We can then convert to a temperature using the formula from the device data sheet:
This will return a temperature in Celsius. I have adapted the Arduino sketch from this excellent Adafruit tutorial so that it will work with the Teensy:
This file contains hidden or bidirectional Unicode text that may be interpreted or compiled differently than what appears below. To review, open the file in an editor that reveals hidden Unicode characters. Learn more about bidirectional Unicode characters
We are opening a serial port at 9600 baud (bits per second)
We are reading from analog pin 9 on the Teensy, where the voltage out pin is connected
We are converting the reading there to a voltage.
We are converting that voltage to a temperature
We are printing that line to serial so that it is transmitted
We convert again from Celsius to Fahrenheit
We print this line to serial as well
We print a new line character so each row only has the one pair of readings
We wait one minute to take another reading
Pretty simple! You can change the delay to any interval you wish to collect more or less data- the units are milliseconds. I wanted to only collect data once per minute, so I set it to 60000 milliseconds. Go ahead and flash this to your Teensy or Arduino using the Arduino IDE, making sure your device type is set to Serial. This is important, as without doing it you will not be able to read the data being sent over serial USB.
All software must have a nice icon.
Now to build the Python program. If you would rather simply download the binaries or clone the repository on Github for the Python client the links are available at the bottom of this page. We are going to use PySerial. We are also going to use Python 3, so make sure you have it installed if you are still using Python 2. Pip install PySerial by typing pip install pyserial. The logger is going to be wrapped in a simple Tkinter GUI. We want to accomplish the following:
Read the temperature data being printed to serial by the Teensy
Save it to a CSV value
Let the user select an interval to read from serial
Let the user select where they want the csv file saved
Let the user select what serial port they want to read off of.
The end result will look like this:
Who says Tkinter has to look ugly?
Let’s take a look at the code and then break it down:
This file contains hidden or bidirectional Unicode text that may be interpreted or compiled differently than what appears below. To review, open the file in an editor that reveals hidden Unicode characters. Learn more about bidirectional Unicode characters
What’s happening here is actually more simple than it seems! Let’s go through how it works, step by step, starting in Main():
We create the root window where all of our widgets are stored (buttons, fields, etc.)
We give it a name
We grid a label
We grid a dropdown menu
We use PySerial to look at all serial ports open on the system and look for one called ‘USB Serial’. By default when you flash the Arduino or Teensy with the sketch shown above it will appear as ‘USB Serial’ on either Windows or Mac computers. We want to make sure the user selects the right serial port, so we filter the choices to these. More than likely there will be only one- the Teensy or Arduino connected to the machine.
We populate the dropdown menu with these serial ports.
We add a button and a counter. The default value of this counter is 60. This is letting the user know that they don’t have to sample every 60 seconds, and they can increment this value if they wish. You can change this value to whatever sampling rate you have set on your Teensy or Arduino in the sketch above.
We add a button that lets the user start the data collection. This triggers a function where we ask the user where they want to save their output file in a save dialog, then open a serial port we called sp using PySerial. We must make sure we open it at 9600 baud, just like the serial port we opened on the Teensy! This is so the two ports can talk to each other. We then create a new thread to run our code in- if we did not, the program would freeze and you would not be able to stop the program because it would constantly be running the timer() function, collecting data, and never returning to the thread running the GUI! We set up this thread to run the timer() function as long as the global variable running is set to true. This lets us have a stop condition to terminate the thread when we are finished. In the timer function we use the filename the user has given to use and every sixty seconds save a time stamp in the first column, the temperature in Celsius in the second column, and the temperature in Fahrenheit in the third column. We read a line of of serial using the PySerial serial port’s readline() function and then convert whatever it gets to UTF-8 to make sure that what we are saving are readable Unicode characters. The output database is always being updated with each minute’s data in a new row! We open the CSV value in append mode (open(f.name, “a“)) so that we do not overwrite any existing data.
We add a button to stop data collection. This sets the global variable running to false, causing the thread where we are saving the temperature data to stop. This halts all data collection.
And we are done! PySerial handles the heavy lifting and we have a nice, simple GUI to collect our data from. The CSV files can then be read into your favorite analysis program to create plots or fits:
A quick plot I created in Numbers, showing that over the short interval tested the temperature did not stray far from 23 degrees.
SHARING THE SOLUTION
You can clone or fork the repository that contains all of these files here or you can download binaries to use right away on your system:
Star Wars has some of the most iconic artwork of any movie franchise in history. Nowhere is this more apparent than in its theatrical posters. This lithopone lamp captures all nine main storyline Star Wars posters (with a blank standing in for Episode 9 until the official poster is released!) in a lovely desktop lamp that celebrates your favorite movies. Simply place an approximately 2.5 inch diameter LED puck light (like you would place under a cabinet) inside the indentation in the base and run the cord out the slot!